The recurrent nova T Pyx is in outburst for the first time in 45 years. Prior to this it had been known to undergo an outburst roughly every 20 years from 1890 until 1966.
The faint southern constellation Pyxis is bordered by Vela, Antlia, Hydra, and Puppis.
There are only about 10 recurrent novae known in our galaxy.
These objects belong to a sub-class of cataclysmic variables, a binary star system in which a white dwarf accumulates matter from a companion star. This eventually sustains runaway nuclear fusion leading to a substantial increase in brightness.
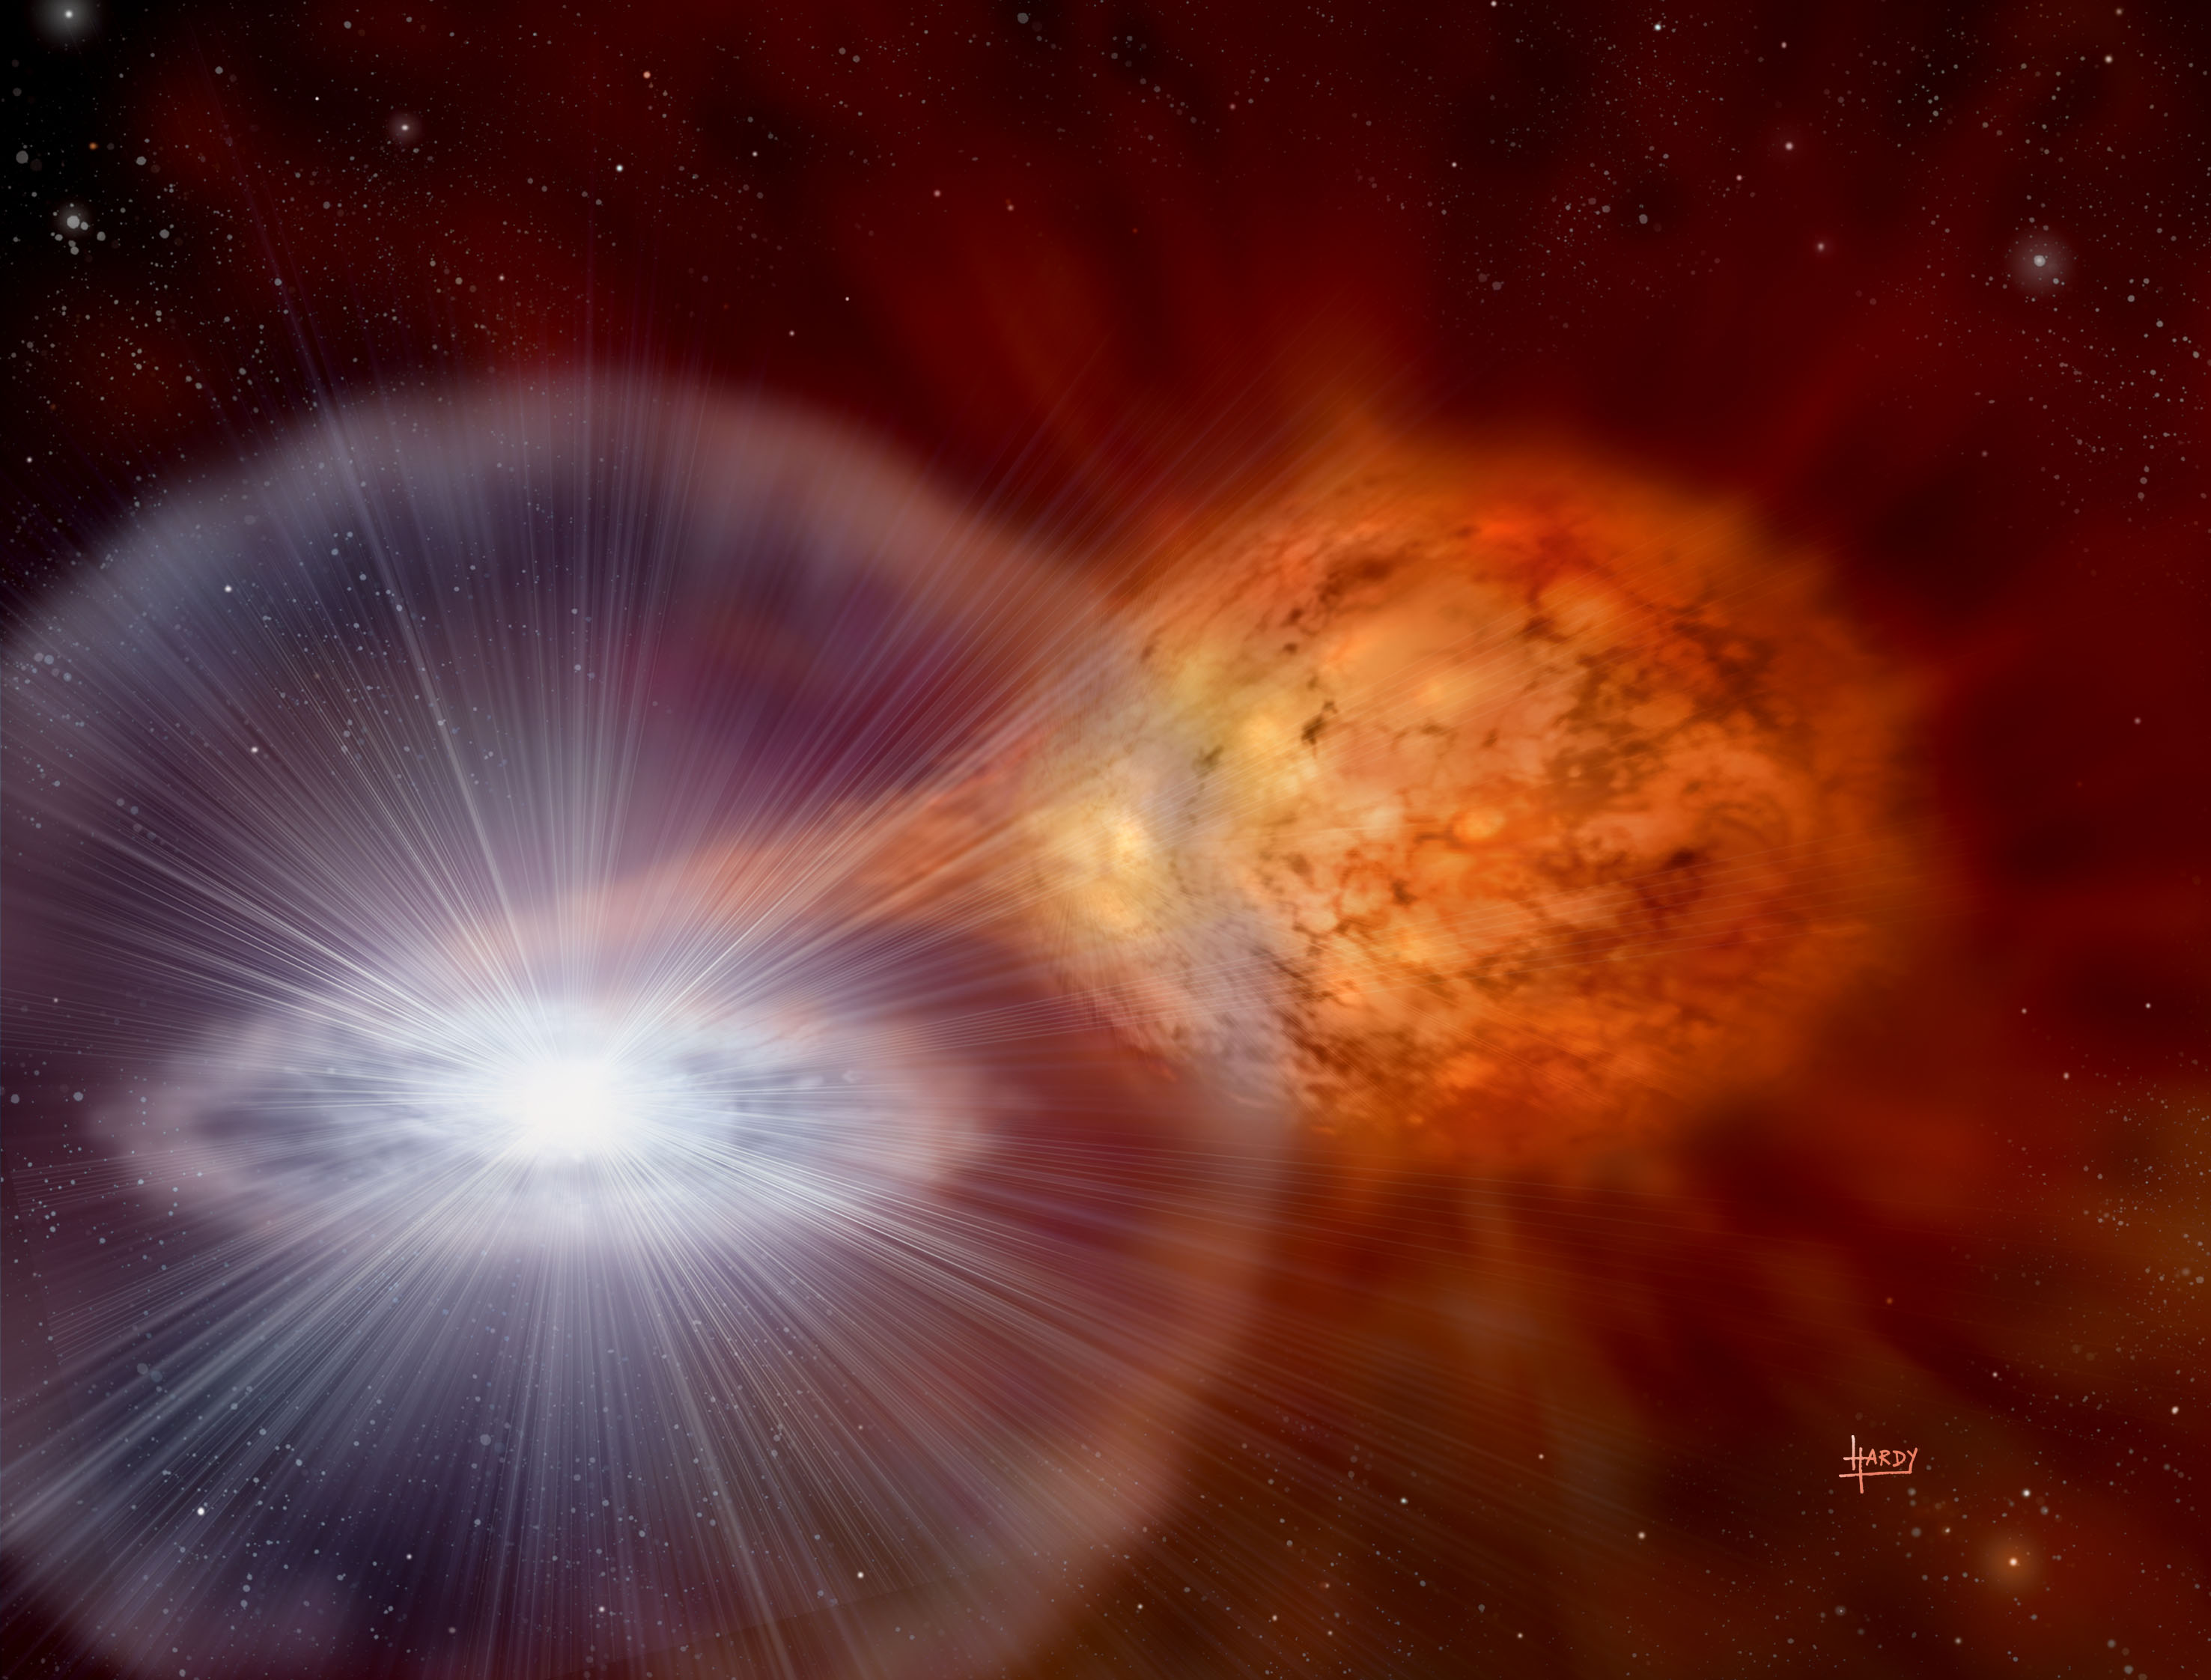
The image below is an artist’s rendering of the cataclysmic variable, RS Oph, that last went into outburst in 2006, reaching naked eye visibility (similarly in 1985, 1967, 1958). Another one, U Sco, went into outburst early last year.

Example of a Cataclysmic Variable (RS Oph) (http://apod.nasa.gov/apod/image/0607/rsoph_pparc_big.jpg)
The 1966 T Pyx outburst reached magnitude 6. It will be interesting to see what its maximum brightness ends up being this time around.
The discoverer of T Pyx was Henrietta Leavitt of Cepheid variable fame. Michael Linnolt, in Hawaii, first reported the current outburst on April 14. Here’s the AAVSO alert notice.
Some of the early confirmation observations were visual estimates by Australian amateurs such as Alan Plummer and Steve Kerr. Photometric estimates appeared soon after, including some from former ASSA member, Peter Nation.
The following plot (using VStar) shows the current and 1966 outbursts along with the many fainter-than observations (in yellow) so commonly recorded in between outbursts. These are where the observer has said: “I can’t see T Pyx, but I can see a faint comparison star, so it’s fainter than that”.

T Pyx data back to 1920 showing visual and fainter-than observations
The 1966 outburst started in early Dec 1966 and T Pyx’s magnitude didn’t reach maximum until early January 1967, then took about 6 months to fall back to pre-outburst levels. From the onset of that outburst, T Pyx took about 2 days to go from mag 13 to around mag 9.5, then around 2 weeks to climb to 7.5, and approximately two more weeks to reach around mag 6. The next light curve plot (visual and Johnson B bands) shows this:

T Pyx 1966 outburst
The current outburst has been in progress for three and a half weeks. After an initial rapid rise of several magnitudes in the first few days from around 14.5 to 7.5, T Pyx has continued an overall upward trend (apart from a couple of brief dips) to a visual magnitude of around 6.8. This is easily visible in 7×50 binoculars.
What follows are three light curve plots showing AAVSO International Database observations from just before the start of the outburst up until May 11.
The first light curve shows only visual estimates.

T Pyx current outburst (visual band)
The second light curve shows visual and Johnson V photometric bands.

T Pyx current outburst (visual and Johnson V bands)
The third light curve shows all bands that T Pyx is being observed in, including infrared.

T Pyx current outburst (visual and various photometric bands)
It’s interesting to notice that the 1966 event was recorded in just a couple of bands, whereas the current one is being recorded in several. That’s a common trend when you look at AAVSO data in recent years, given the equipment now available to amateur astronomers, and the increasing number of telescopes that can be accessed via the Internet (e.g. global rent-a-scope).
Notice that the magnitude range varies with band, particularly relative to visual and Johnson V observations.
The visual estimate of magnitude 6.9 at the cross-hairs on May 2nd is my single contribution so far. Pyxis consists of fairly faint stars, so I spent a few nights just getting used to the binocular and low power telescopic fields before attempting an estimate.
It’s fascinating to watch this event unfold. Of course, given its distance, we are actually seeing an outburst that happened more than 3000 years ago.
Further reading:
- http://www.aavso.org/vsots_tpyx
- T Pyx: The story that just won’t die (written before the outburst)
- http://en.wikipedia.org/wiki/T_Pyxidis
October 16, 2011 at 1:33 pm |
[…] Outburst of recurrent nova T Pyx […]